18 August 2005
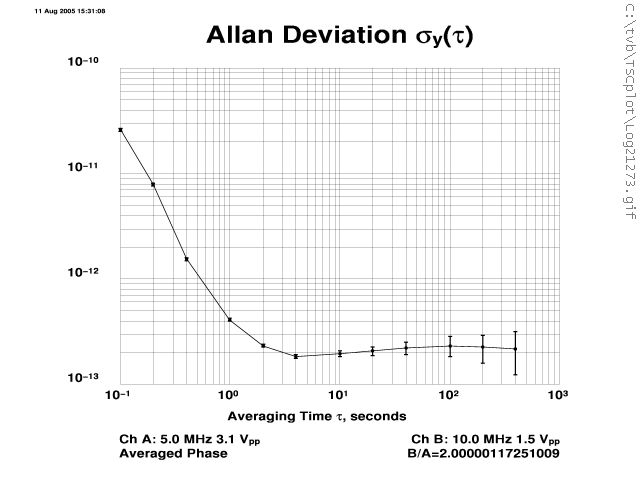
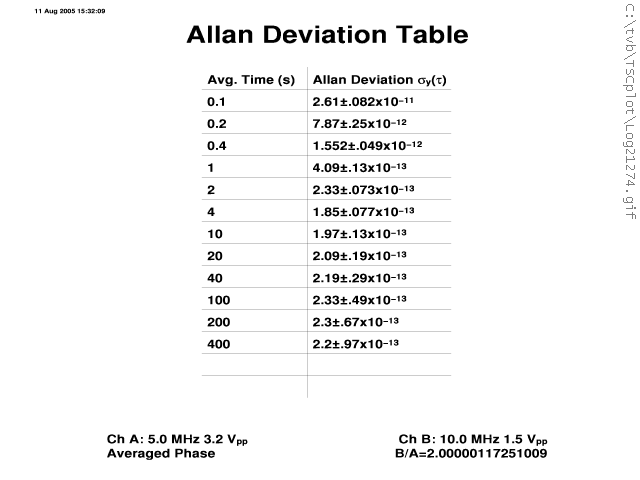
The Datum 1000B is a high-performance quartz oscillator found in some telecom frequency standards and the LO in some cesium standards and hydrogen masers. It is stable to low parts in 10-13 making it one of the better quartz oscillators available today.
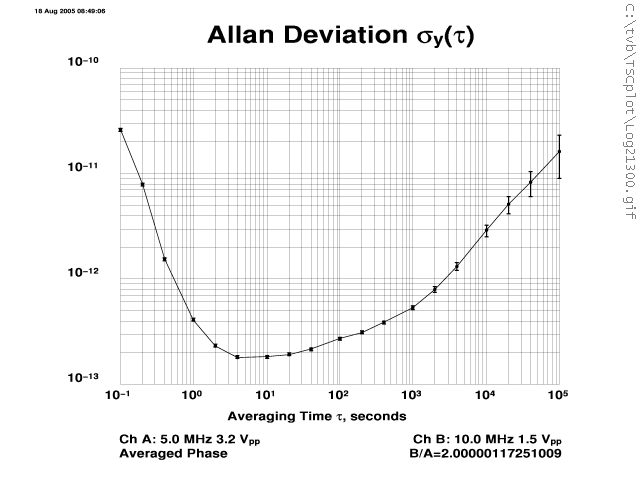
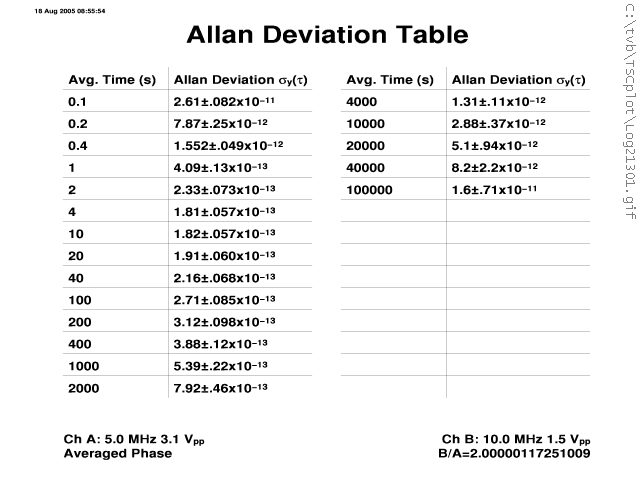
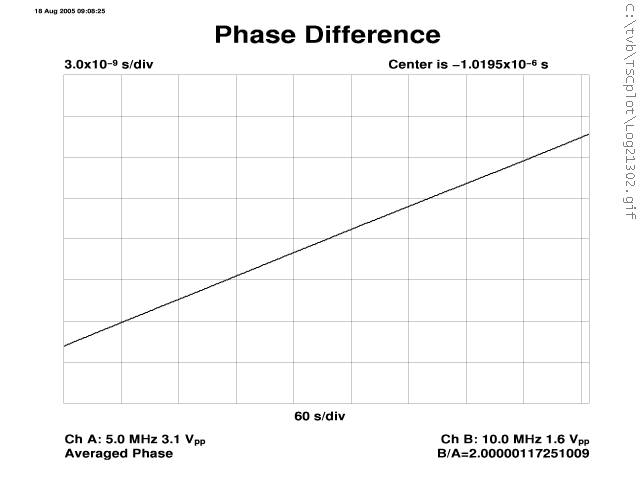
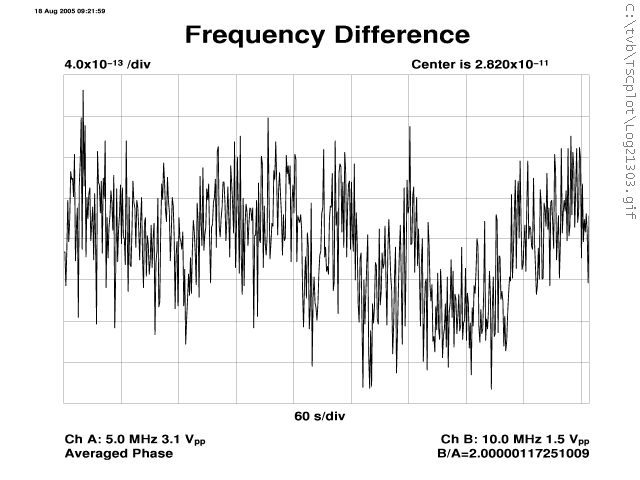
The following are some performance plots made during a one week test of a Datum 1000B. It had been powered up for many months. Not all 1000B show the exactly the same performance; below is the best one I found.
| Allan Deviation plot out to 100k seconds |
 |
 |
 |
 |
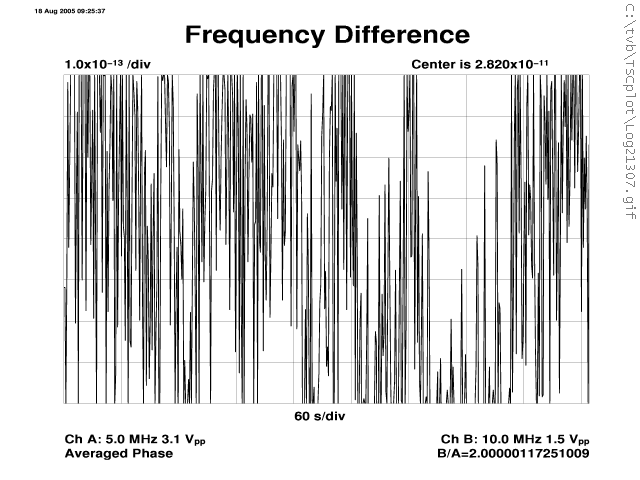
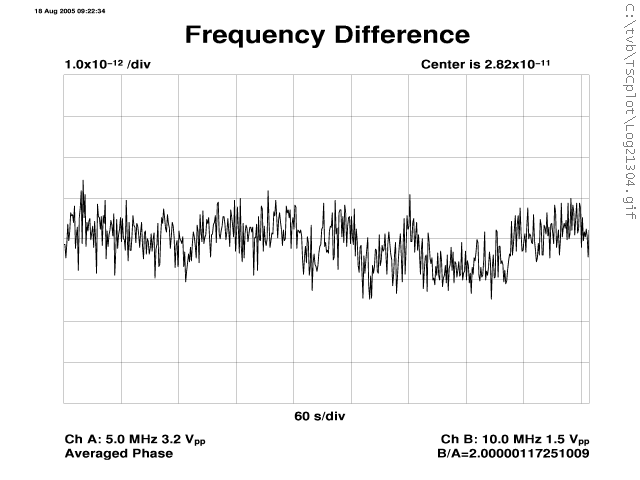
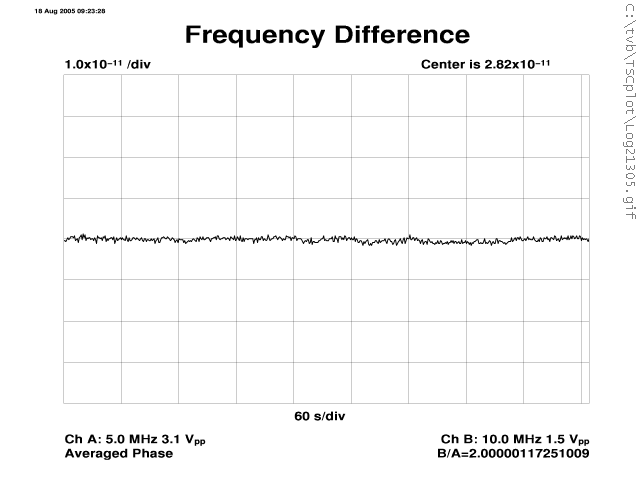
| 10 minute phase plots at decade scales: -13 to -10 per division |
 |
 |
 |
 |
| Half hour run showing noise floor without drift taking over yet |
 |
 |
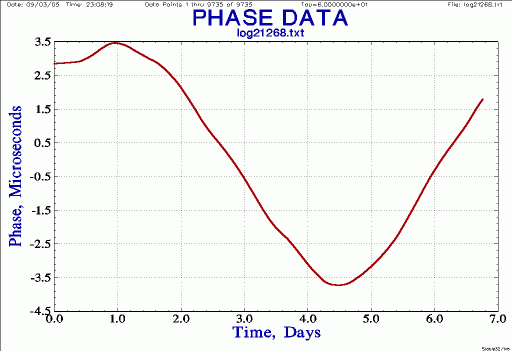
The following plots were made from 1 Hz phase samples of a 584,091 second run (6.7 days).
| 1 minute averages, normalized phase, unusual behavior |
 |
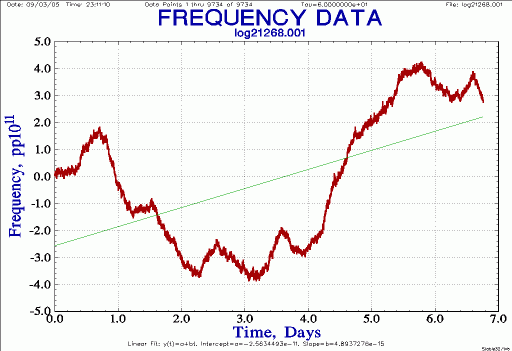
Diurnal effects can be seen in the frequency plot below; the daily bumps are on the order of 1 or 2 parts in 10-11. Based on the first few days one might think the frequency drift rate is on the order of 2 or 3 parts in 10-11. But then the drift rate changes for the next few days. This is another case where a couple of weeks or months of data would be useful before any solid conclusion of drift rate could be made.
| 1 minute averages, normalized frequency, diurnal effects and drift reversal |
 |
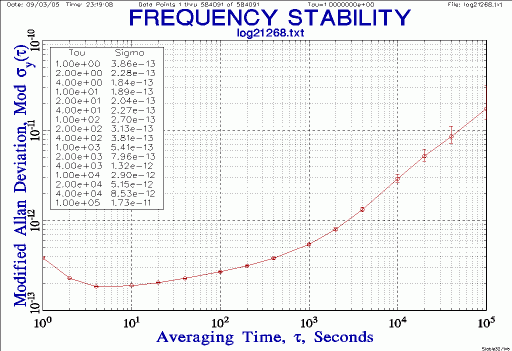
The ADEV plot below (made from raw 1 Hz phase samples and plotted with Stable32) matches well the plot made by the TSC 5110A. Computed drift rate is 9e-12/day but based on the frequency plot above it's clear this calculated value is not relevant.
| Allan Deviation plot out to 100k seconds. |
 |
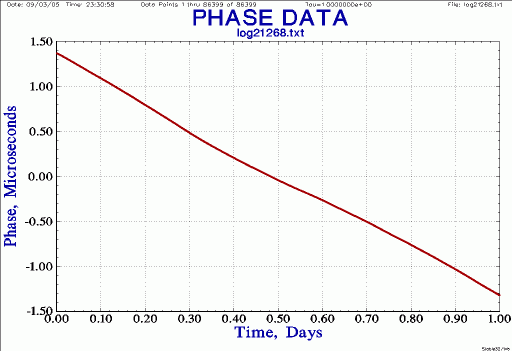
To get a closer view of the oscillator's performance minus the unusual drift rate let's look only at 86400 samples of the 3rd day.
| 24 hours, normalized phase |
 |
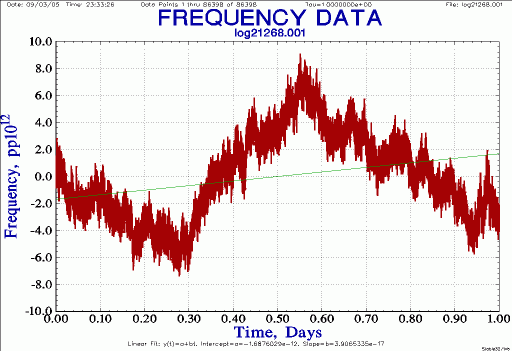
The frequency plot below shows a very nice diurnal. I would guess the room temperature changed by about 5 C from day to night. The frequency changes by about 1e-11 giving it a tempco guess of 2e-12 / C.
| 24 hours, normalized frequency |
 |
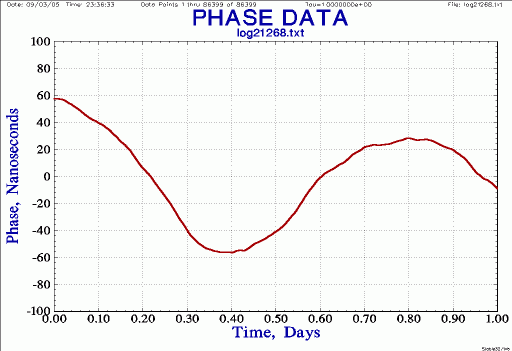
| 24 hours, phase residuals |
 |
| 24 hours, Allan Deviation |
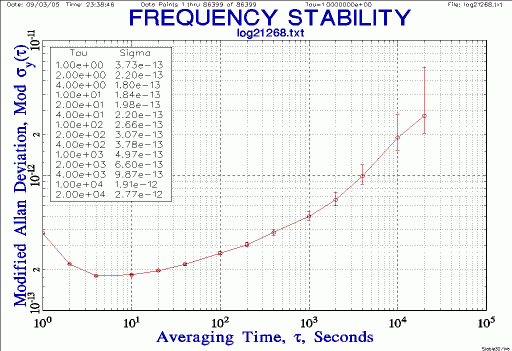 |
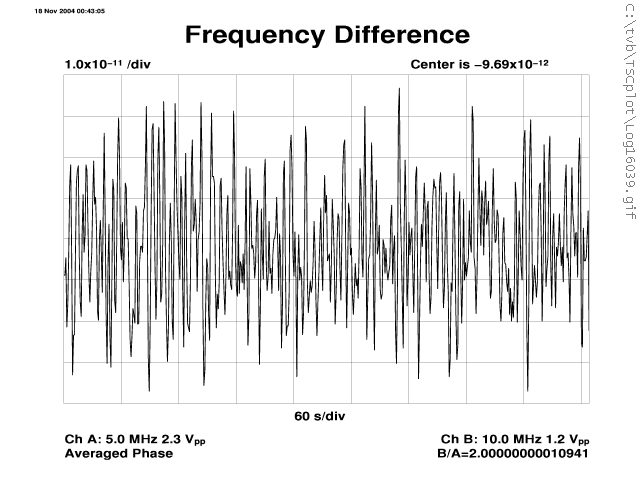
Below are two phase plots made with the same scale. The first plot is a PRS10 and the second is a 1000B.
| PRS10, 10-minute phase plot, 1e-11/div |
 |
| 1000B, 10-minute phase plot, 1e-11/div |
 |
The above is a reminder why some people would never trade their fine old quartz frequency standard for an atomic clock. For the worst-case of tau at 2 seconds the PRS10 has an ADEV of 1e-11 while the 1000B has an ADEV of 2e-13; 50x better.