| LeapSecond.com :: Museum of Time & Frequency |
|
|
| mc859x4-034w |
|
|
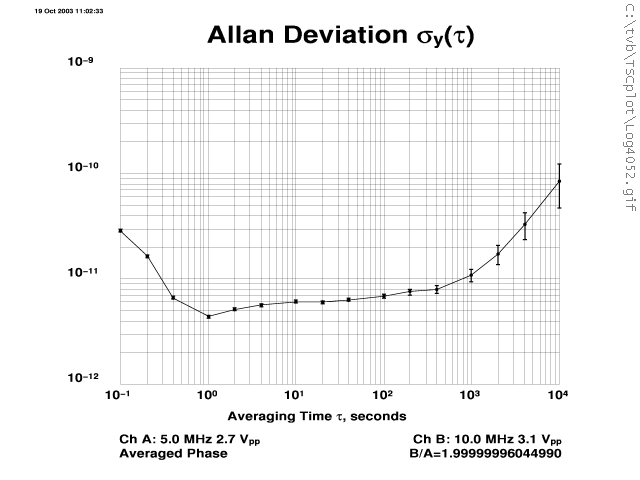
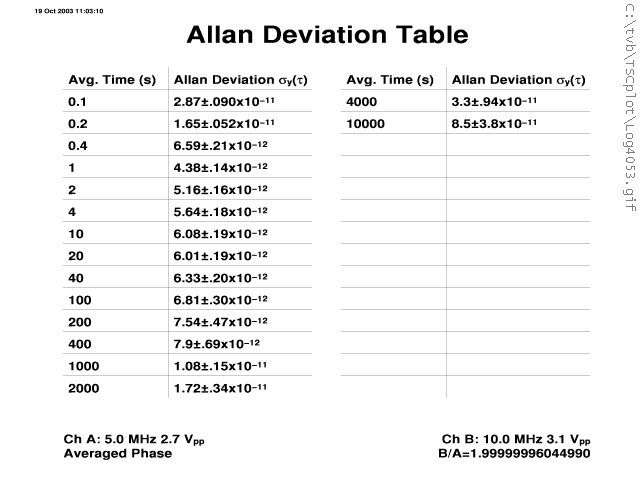
Here are the performance results of this nice compact OCXO.
The stability peaks at a low of just under 5e-12 at 1 second. The stability stays under 1e-11 all the way out to 1000 seconds. At this point drift takes over.
| TSC 5110A plots - Allan Deviation out to 10k seconds |
|
|
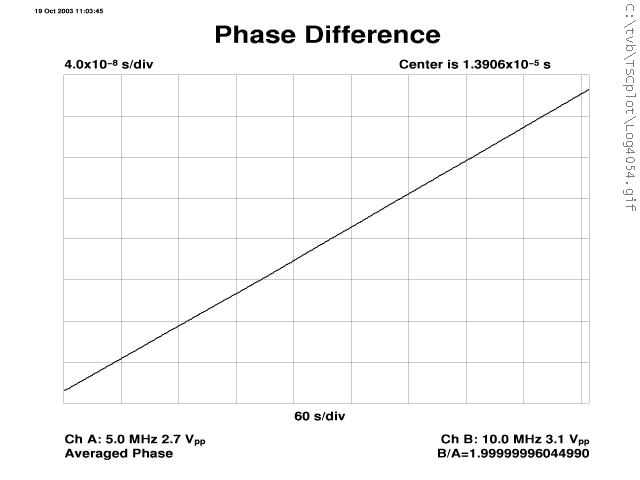
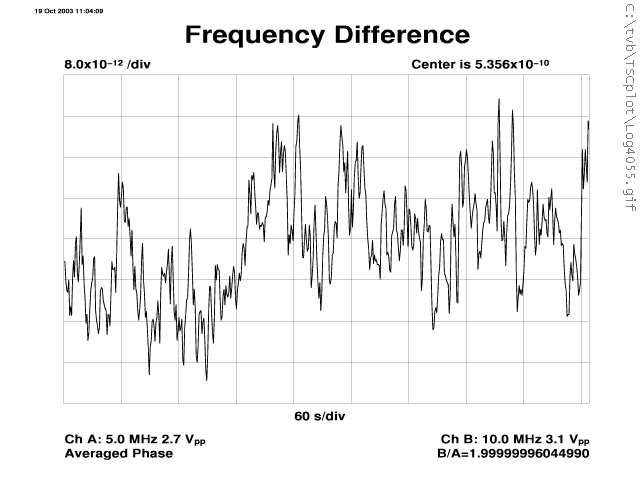
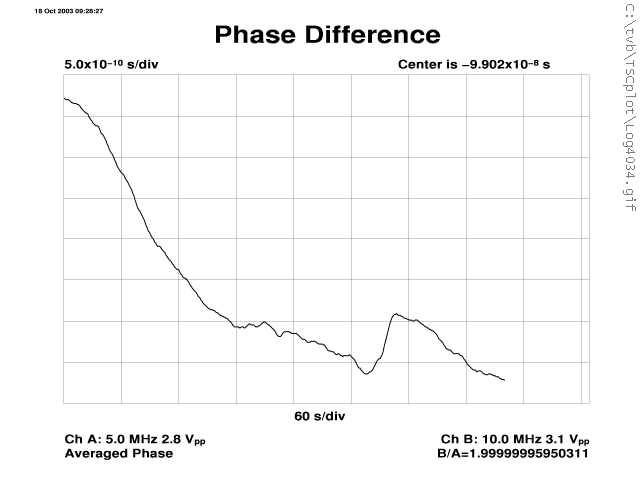
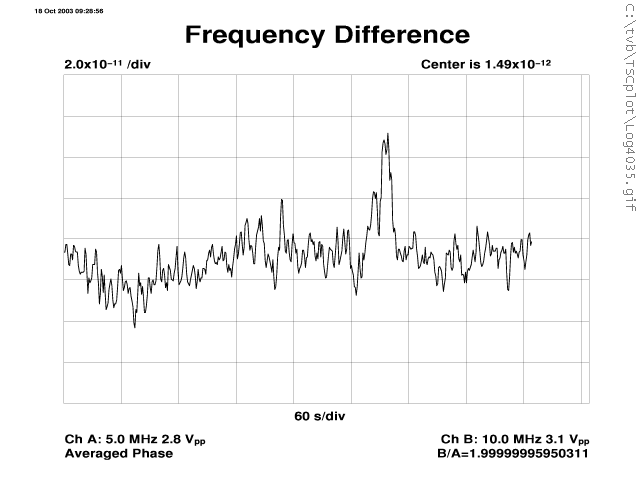
The phase plot below is fairly meaningless since the oscillator has drifted sufficiently from the reference to make the phase difference plot a straight line with +1 slope. The frequency plot is nicer; showing visually the frequency stability from time frames of 1 second (one pixel) to 10 minutes (full scale). Peak-to-peak frequency excursions over 10 minutes are less than 8 divisions at 8e-12 per division for a total range of about 6e-11.
| TSC 5110A plots - after 12 hours, a 10 minute sample of Phase and Frequency |
 |
 |
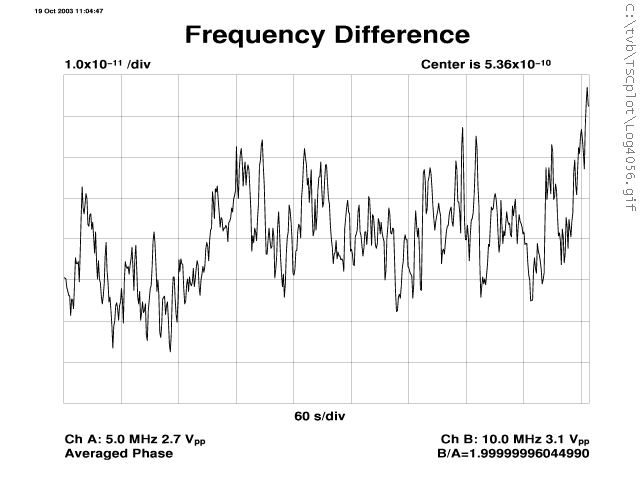
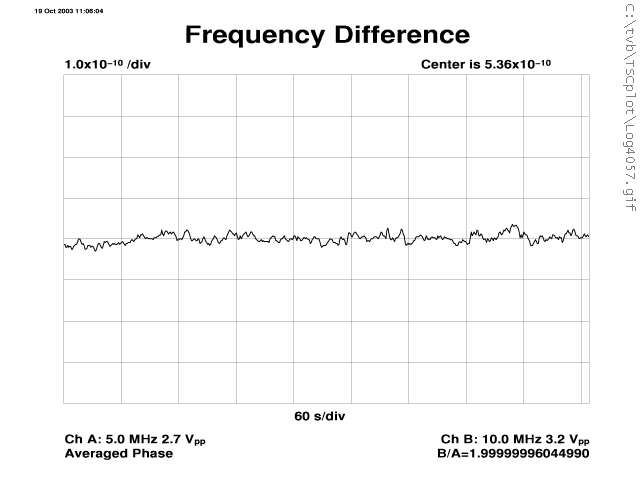
The following are essentially the same plots but scaled to 1e-11 and 1e-10 per division.
| TSC 5110A plots - 10 minute samples of Frequency - different scales |
 |
 |
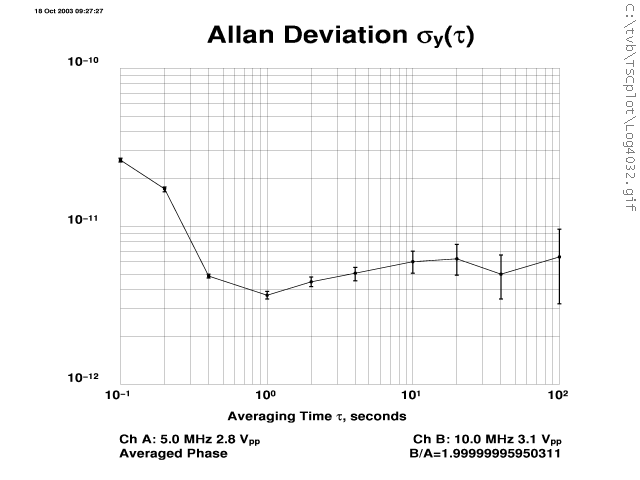
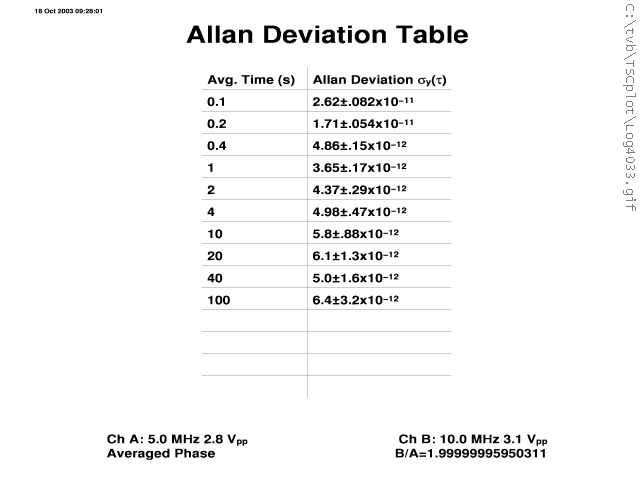
A trick to get short-term stability measurements for an oscillator that is still drifting is to reduce the Allan Deviation sample count so that the effect of frequency drift does not take over the calculations and pull all the numbers up. The following is a run lasting only about 8 minutes.
In this case the stability gets down to 3.6e-12 at 1 second, staying under 6e-12 from 0.4 to 20 seconds. The total phase difference is less than 4 ns and the frequency range is mostly within a 2 to 4e-11 band.
| TSC 5110A plots - Stability, short-term, reduced sample count. |
 |
 |
 |
 |