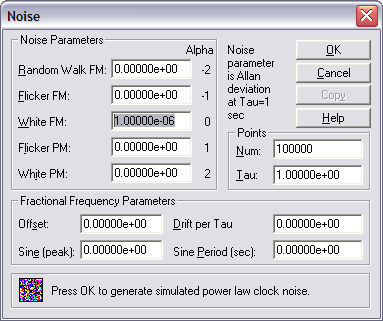
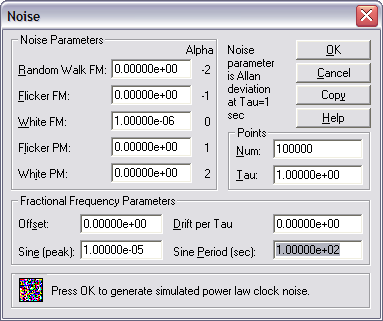
You can use Stable32->Generate->Noise to create synthetic phase/frequency data having certain noise types (alpha). This is useful to explore the concept of power law noise. For example, create 100,000 points of 1 ppm white FM noise with:
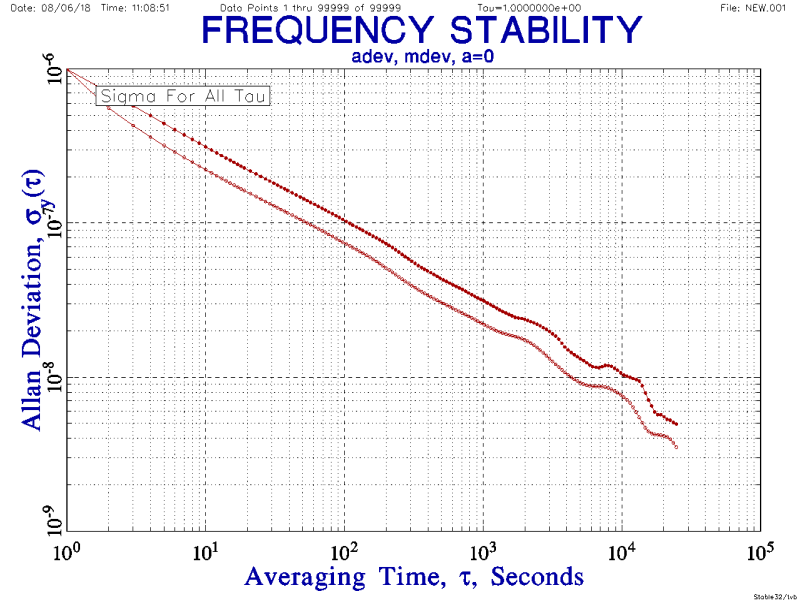
The resulting ADEV/MDEV plot for that data show the expected -1/2 slope:
You can do the same for all five noise types (alpha -2,-1,0,+1,+2) and then use TimeLab (which allows simultaneous plots):
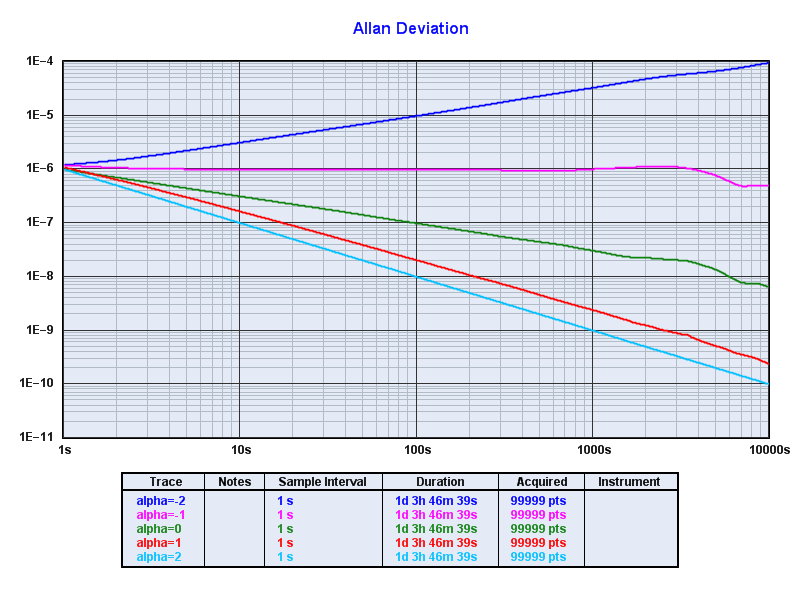
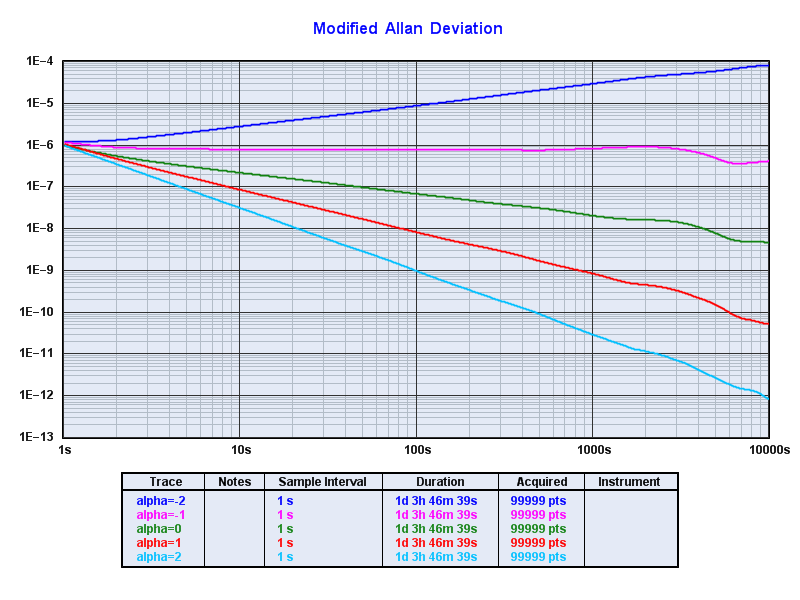
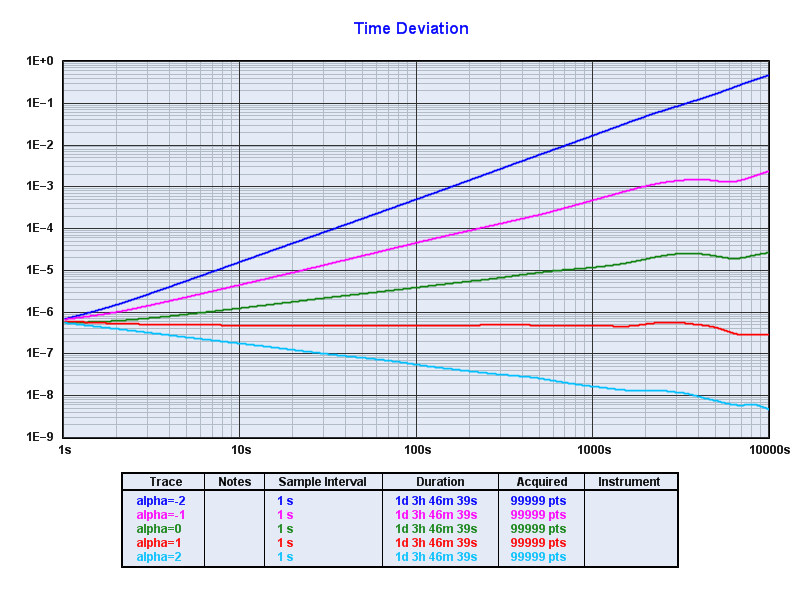
See Exploring Allan Deviation for a more complete chart showing how noise type is related to phase, frequency, adev, and power spectrum.
Stable32 also allows one to apply sine modulation to the generated data. In this example we take a 1 ppm WFM (alpha=0) data set and apply sine modulation of magnitude 10 ppm and 100 s period:
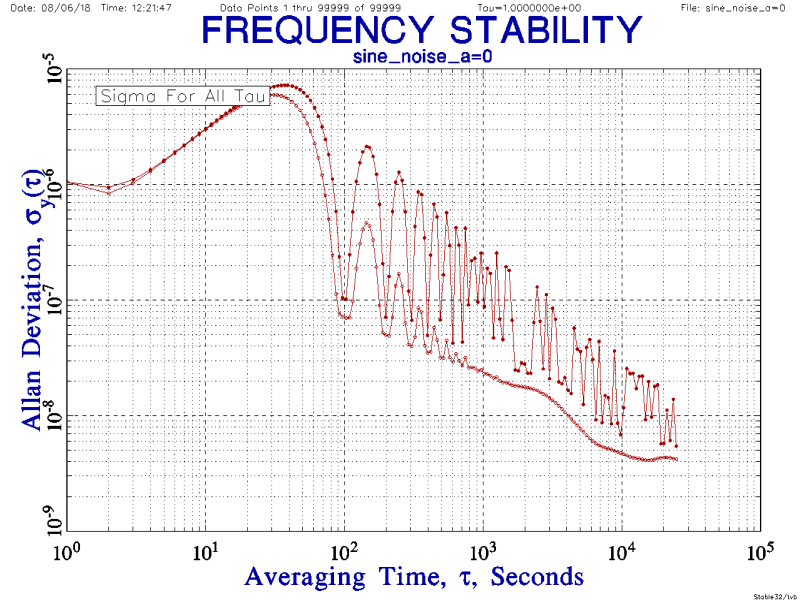
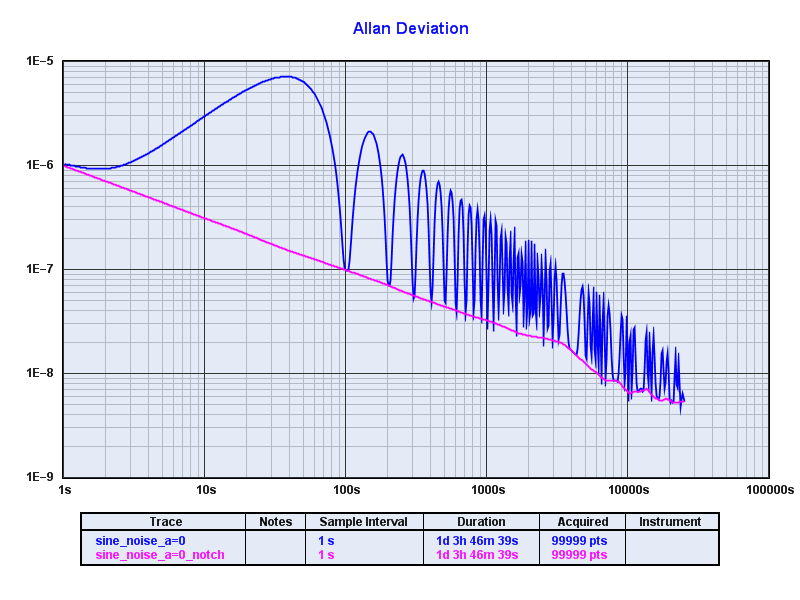
The ADEV/MDEV plot now dramatically shows effect of sine modulation:
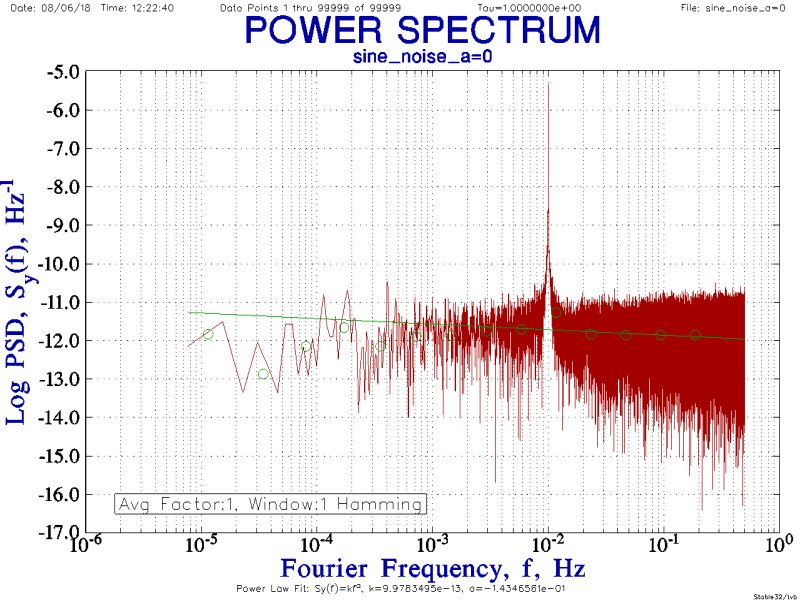
A power spectrum plot tends to be a clearer way to reveal FM:
Still, the effect of sine modulation on ADEV is very instructive because these camel-hump wiggles occur naturally under certain conditions. For quartz and atomic clocks it could include mains power noise, HVAC cycling, and diurnal effects. For mechanical clocks it could include the effects of gear teeth, unbalanced hands, winding cycles, and other long-term periodic perturbations in rate.
In the above example note that the worst case instability occurs at tau 50 seconds followed by a best case at tau 100. The alternating pattern continues as tau increases. In general best case ADEV always occurs for tau that are exact integer multiples of the modulation period and worst case ADEV occurs for tau halfway in between.
The actual appearance of the plot is directly related to modulation magnitude, modulation period, and tau. The plot is also affected by the precision of the modulation (Q), the precision of the tau, the degree to which they are exact integer multiples of each other, and even the software implementation of the ADEV algorithm. For example, the plots may look quite different if ADEV is computed by decade, or by octave, or by "many tau" or "all tau".
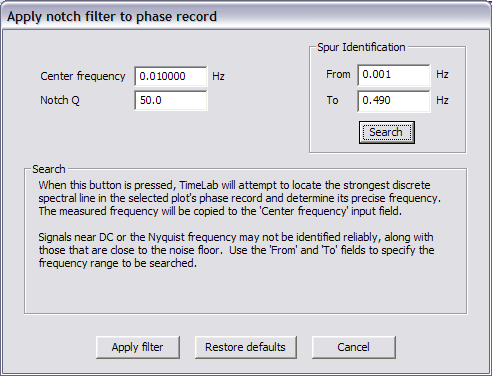
TimeLab has a 'n' command (apply notch filter to phase records) which can be used to identify modulation as well as remove it. This technique is appropriate when the modulation source is "clean"; that is, has a consistent magnitude and period.
Using 'n', we search for modulation and TimeLab correctly identifies a strong 100 s period (0.01 Hz frequency):
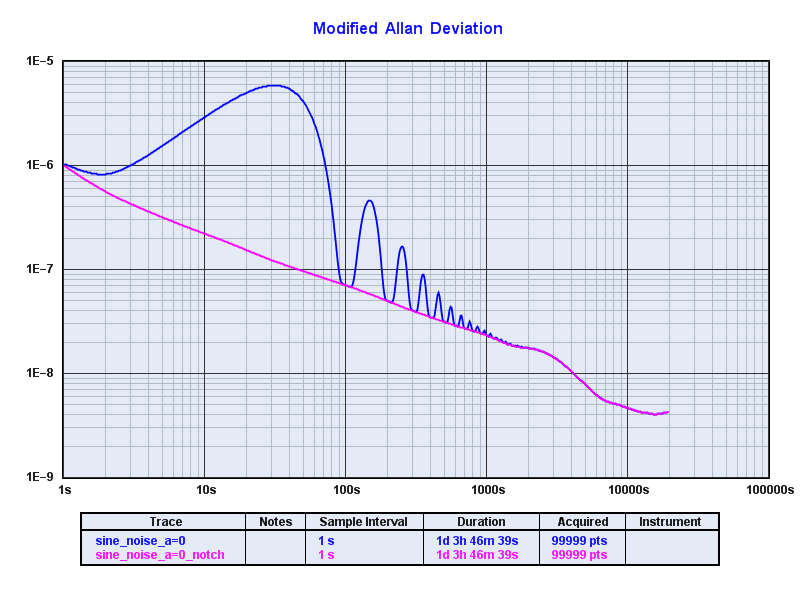
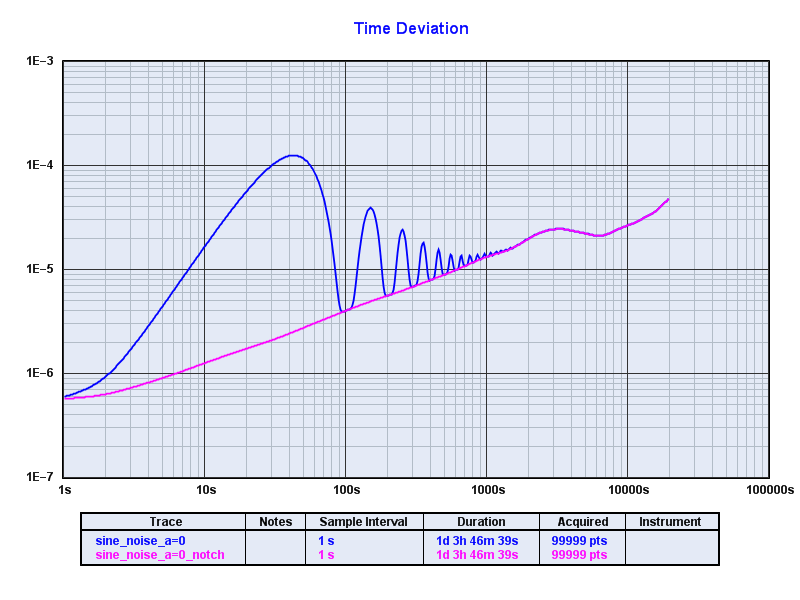
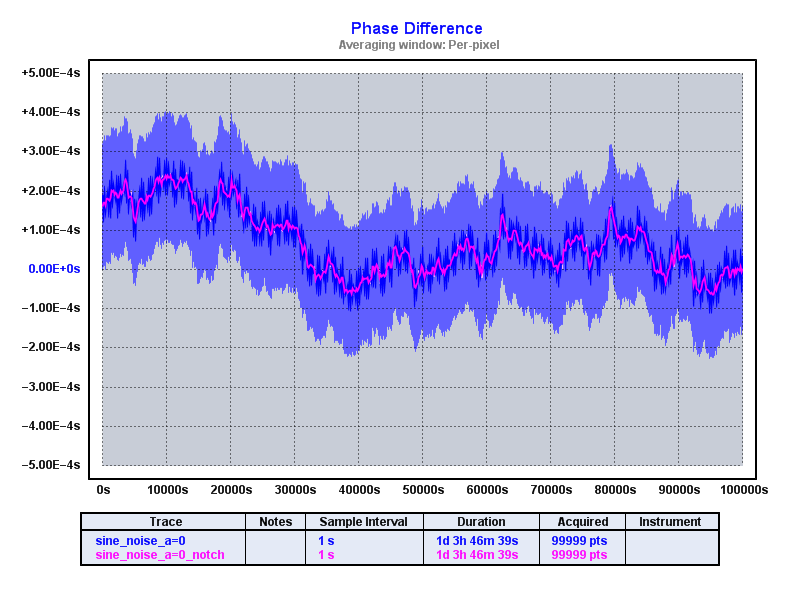
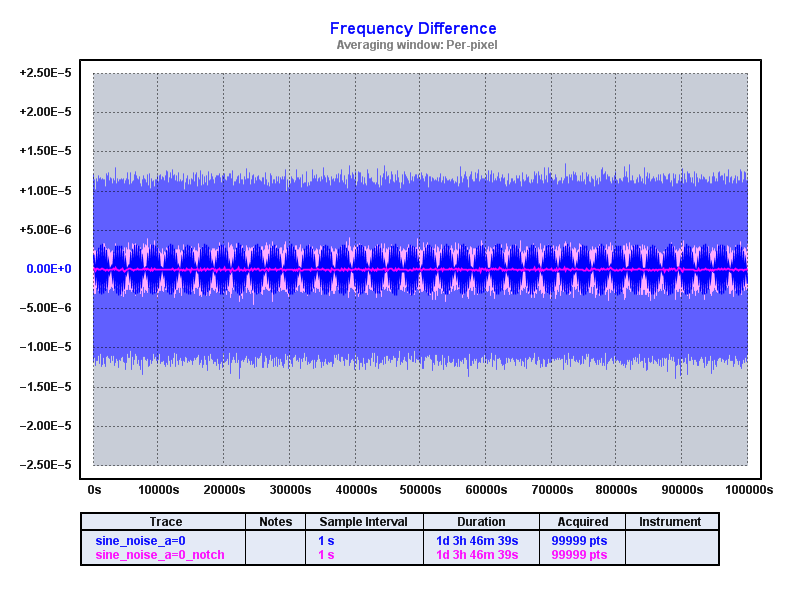
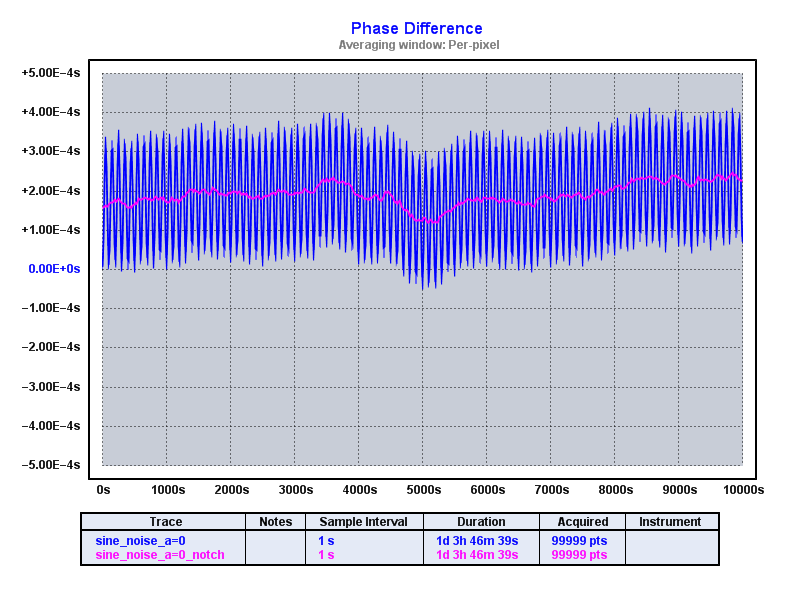
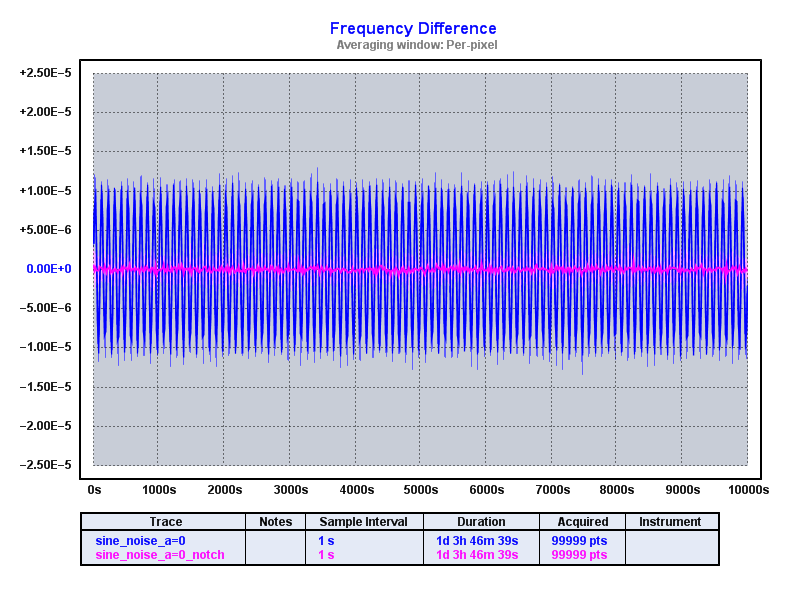
Clicking "Apply filter" then does the magic and we're left with the residuals. The following shows two traces per plot: the original sine modulated data (blue) and the notch filtered data (pink):
Showing full 100k time series:
Showing first 10k points only:
Showing first 1k points only:
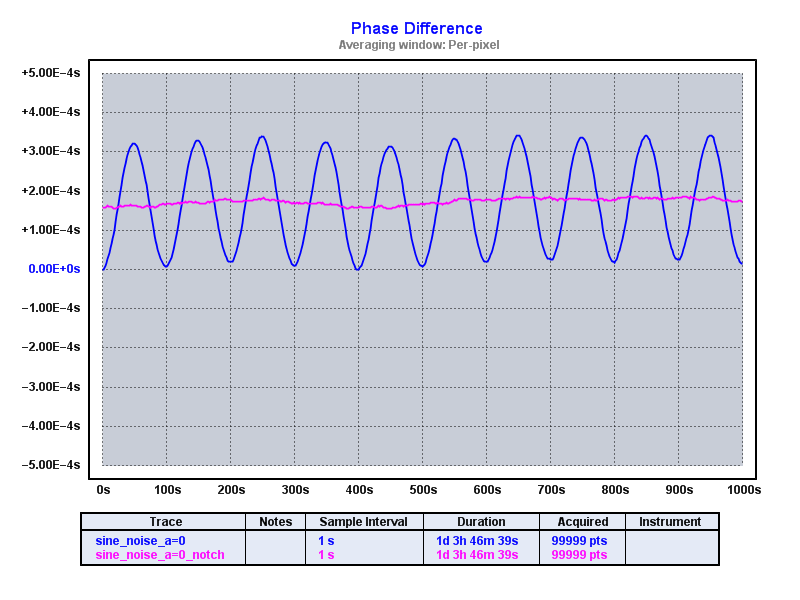
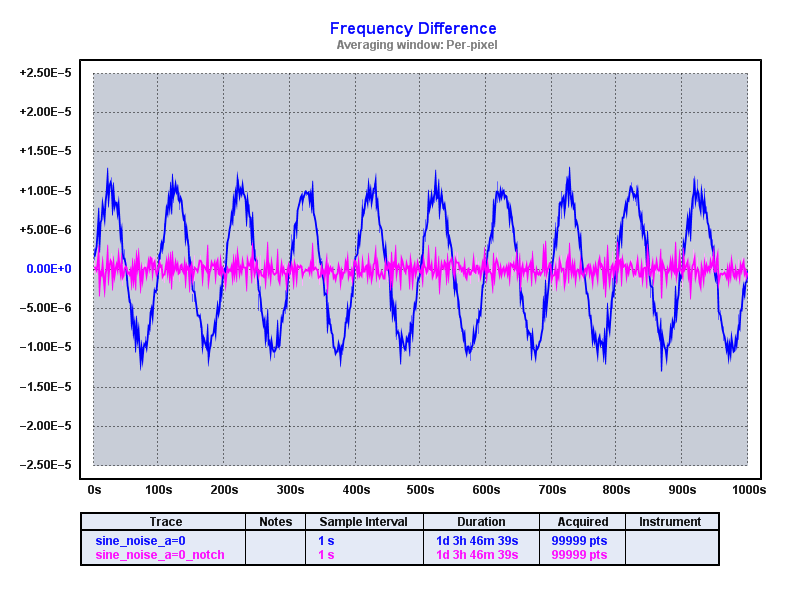
In all cases we see how well the notch filter works.
sine-noise.frq.gz
sine_noise_a=0.tim.gz
sine_noise_a=0_notch.tim.gz
Other files available on request.