22-June-2005
Below is a copy of my email lab notes to John while testing his new RF distribution amplifier.
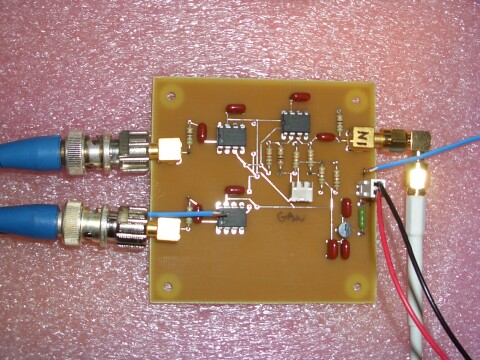
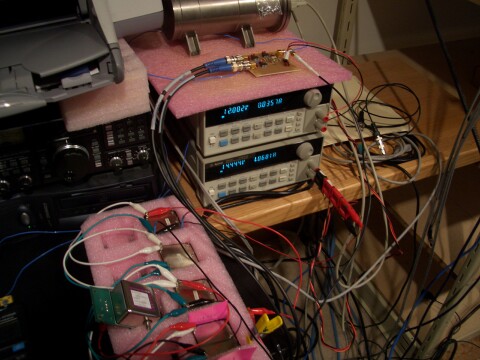
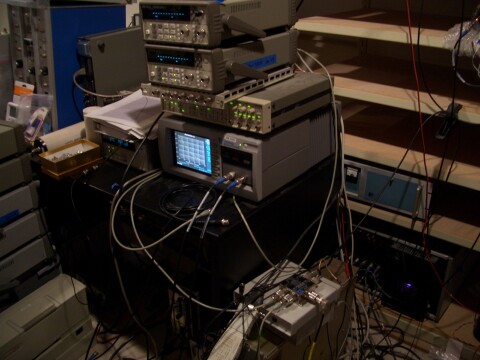
| John, Since this is now on a web page I thought I'd send you some photos of the setup I'm using. The first photo shows your board as I'm testing it. My 5 MHz house reference comes in on the right as the gold right-angle SMA. For the two outputs on the left I used high-quality SMA-BNC adapters to connect to the pair of mil-spec 10 foot cables than run over to the analyzer. I had a pre-wired red/black molex cable for the power; how convenient. The two thin blue wires you see over the board are the thermocouples I used to keep an eye on variations of ambient and board temperature. The second photo shows the board on top of an Agilent 6612C power supply set to 12.000 V. In the foreground, unrelated to this test, are a bunch of MTI oscillators I'm warming up. The third photo shows the TSC 5110A which is what I used for most of the testing. It has a time interval resolution of around 100 fs. There's some other random T&F gear above and below it too. In the lower right corner you can see a glimpse of the blue/purple glow of a passive H-maser. /tvb |
|
 |
 |
| John, First results are really good. Very clean. Attached is a plot from a sort of noise floor test where I put a nice 5 MHz in and then compared the two outputs against each other. The first plot is scaled 0.1 ps per division vertical and one minute per division horizontal. The room A/C was cycling about every 10 minutes and the PCB temp varied from 80 to 82 F during the cycles. The plot shows less than 0.3 ps variation over a temp change of about 1 C. The second plot is the same thing with the scale set to 1 ps/div. So this means the channel-to-channel tempco is under 1 ps / C. The next test is input to output noise floor. /tvb |
 |
 |
| John, Here are two plots for the input-output case in the same scale as the previous two plots. A little more noise, a little more tempco, but still fantastic. I may want to work on these tests some more since this is getting close enough to my lab noise floor that I need to be careful about a number of things, like the source, the splitter, connectors, cables, the airflow, etc. The ADEV of this thing is 1e-14 at 10 s so it will work for any frequency standard that any time-nut wants to through at it. You've got a winner here. Next, some load and voltage tests. /tvb |
 |
 |
| Attached is an input-output plot showing the approximate effect of open, short, and 50R load on the other output. The sequence, spread over several minutes, is open, 50R, open, short, open. The results are quite stunning. I would have expected much more effect. Instead there is just 8 ps total shift from open to short. You can also see a slight, slow, temporary drift after a load change; probably thermal. At 12.00 V the current draw is 37.3 mA (open), 46.6 mA (50R), and 56.9 mA (short). /tvb |
 |
| John, Attached is an input-output phase plot showing the approximate effect of supply voltage. I made a change every minute or two. For this test the second output was 50R terminated. The sequence is 11V, 12V, 13V, 15V, 11V This is quite nice. I'd say there is no need for any external regulation. The phase shift gets very bad down at 10V so 11V is pretty much the minimum. Above that it's less than 1 ps / V. /tvb |
 |
| John, All the tests were done at 5 MHz. It's hard to imagine getting different results at different frequencies but I'll leave that as an "exercise for the reader". I can't test phase noise right now since the instrument is put away. So it'll wait for later or someone else can run that test. Someone else can run it through a network analyzer and make a nice phase/gain plot. I didn't experiment with the effect of input levels at all. The 5 MHz feed was generous; about 2.2 Vpp (just over 10 dBm, I think). Now, there are quite a few commercial T&F RF distribution amps out there. Most seem much more complicated than yours. So the question is, why? Do they know something you don't? Are there other pertinent specs that you don't address? Is it just because most of them use parts from 20 years ago? When I have time, I'd like to run some of these commercial units through the same tests I just did on yours. I probably have a dozen different brands and models to try. A project for later. Trying larger temperature ranges is something to check. I'd have to dig out my insulated, one cubic foot, PID-controlled, Peltier box for that. It was convenient to measure in my lab today since the A/C just happened to be cycling every 5 to 10 minutes slowly changing the air flow by 2 F peak to peak. Anything else you want me to check out tonight? Otherwise I'll start a 24h run and look for longer term drift in the board. /tvb |
| John, Here are two input-output phase plots. The first is a 30 minute view of the A/C effect on the board. It doesn't show anything different from the plots last night but I thought you'd like this because Stable32 chose to label the axis in units of femtoseconds and that looks kind of cool. The second is an 8 hour run last night with two things to note. First, there is a drift on the order of 5 or 6 ps during that period. The previously measured tempco of 1 ps/C suggests this overnight drift is not likely temperature related. It could be cables or mechanical stresses reaching equilibrium in BNC connectors. Or humidity slowly affecting cable dialectric. Another likely cause is new components settling in. I really have no idea. If I were to look into this it would take days or weeks of data to look for trends, etc. But you should also know this is quite common; lots of weird stuff happens at the ps level in a home lab. And the rate of drift, say 20 ps a day, puts this "noise" down in the in the -16's so not to worry. The other thing to note in the plot are the spikes. This is less common, and often the result of less than perfect connectors, or cables, or solder, or kids playing next door, or whatever. I didn't see this on my shorter runs earlier. I normally would solve these problems, or re-run the data, or just toss the data out, but in this case I wanted you to at least see it just to get a feel for life in the picosecond world. /tvb |
 |
 |
| John, One more result for you -- the latency of the dist amp at 5 MHz is about 1 ns. I got this by measuring A, measuring B, and then replacing the board with a 1 cm SMA male-male adapter but keeping everything else the same. Phase plots attached. The raw data is: mean phase, channel A: -30.718 ns mean phase, channel B: -30.675 ns mean phase, jumper: -29.772 ns So the board delay at 5 MHz is about 0.9 ns. It also looks like the channel-channel phase difference is on the order of 50 ps. /tvb |
 |
 |
 |
| John, I also realized that the previous plots can be used to graphically show the added jitter of the dist amp. So attached is a 3 frame 1 fps animated GIF showing the reference signal going through channel A, channel B, and the board-bypass shunt. I set the scale to be the same in each case; 2e-13 = 0.2 ps / div vertical, which means it's 1.6 ps full-scale. The message here is that this board is really low noise. The plot also serves as a verification that the test rig itself exhibits some noise and tempco but that its noise and tempco are about 10x less than the dist amp. This gives me some confidence that the measurements I've been making the past day are valid. /tvb |
 |
| John, I wanted to measure the tempco a little more precisely so I used a logging 0.01 C resolution thermometer placed near and above the board. MJD timestamped readings were made every 10 seconds and these are plotted below in red. TSC 5110A time interval readings were averaged every 10 seconds and these are plotted in blue. The lab thermostat and summer weather cause the A/C to cycle every 5 or 10 minutes. Below is a one hour plot showing both the board latency and the ambient temperature tracing sinusoidal curves; the correlation between the two is very high. For this particular plot both scales were manually adjusted until both curves were close to the same size, peak to peak. From this we can conclude the board tempco is +1.0 ps / 0.4 C which is: +2.5 ps / C (1.4 ps / F). /tvb |
 |
| To clarify, a tempco of 2.5 ps / C means you get an unwanted phase shift of 2.5 ps for a 1 C change in ambient temperature. You can't directly relate that to frequency shift unless it is specified how long it takes for said temperature change to occur. Phase shift is just phase shift; but phase shift over time is frequency shift. To illustrate, as an extreme example, if the 1 C ambient temperature change were to occur over a time span of just one second (think freezing to boiling in 100 seconds!) you would see the board phase shift by 2.5 ps per second; which is equivalent to a frequency offset of 2.5e-12 (during that one second). On the other hand, as a more practical example, when the ambient temperature changes by 1 C over, say 500 seconds (about 8 minutes), then 2.5 ps per 500 seconds is a frequency offset of 5e-15. You aren't going to see this. So you see how temperature stable the dist amp really is. I wouldn't change anything. The carbon comp resistors are suspect, but even as-is this tempco will be in the noise for everyone. I can't wait to test the 5087A to see how it compares. Below is an ADEV plot of your distribution amp. It represents a noise floor for any measurement made using a signal from the distribution amp. As you can see, it is orders of magnitude below any OCXO, cesium, or GPS ADEV plot. Even without an enclosure, and with my lab A/C cycling the way it is this summer, the only effect you can see in the plot is a slight hump around tau 100 seconds. Another view of the tempco can be observed in a Stable32 power spectrum. I've circled a spike around 3e-3 Hz, which is the "frequency" of the A/C -- its on/off cycle, and thus the period of the slow sinewave thermal cycle, is on the order of 300 to 400 seconds, so frequency is 0.003 Hz. /tvb |
 |
 |
 |