A PC contains many timing sources. The obvious one is time-of-day, which is implemented offline by a lithium battery powered 32 kHz CMOS clock chip and online by the continuous counting of crystal controlled periodic programmed interrupts. Neither is known for its great accuracy. Other timing sources include high-resolution timers, CPU clock cycle timers, serial port baud rate generators, video frame generation, and sound card time bases.
So how accurate is a typical PC sound card? How stable is the output? How would one measure this?
It would be easy to have a sound card generate, say, a 1 kHz tone and then measure the accuracy of that signal.
Instead I wrote a simple tool that generates 1 PPS with a sound card. With a typical CD-audio sampling rate of 44.100 kHz (22.675 µs per sample), the tool creates a repetitive waveform consisting of 44099 zero voltage samples and 1 non-zero voltage sample. The result is an audio output that is all quiet except for one sample each second.
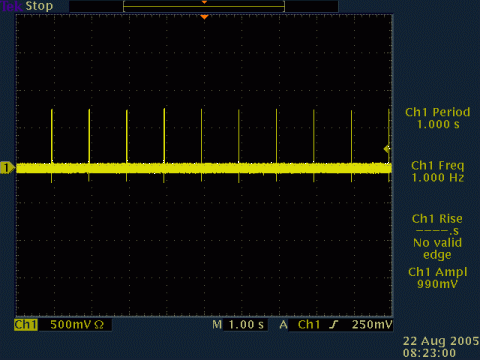
On an oscilloscope the output is a series of familiar-looking 1 PPS pulses below:
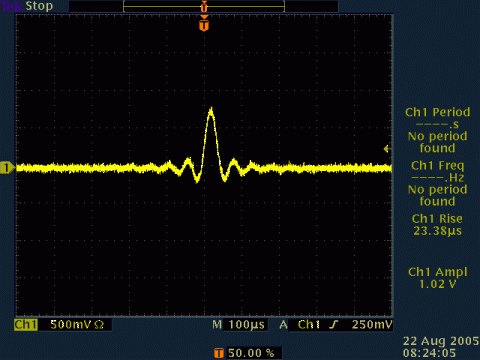
A closer look at one pulse, below, shows the rise-time is on the order of the width of one sample, around 20 microseconds.
The output impedance of a PC sound card headphone output is quite low so either 1M or 50R input termination can be used. For a TI counter use a 250 mV DC trigger level at 50R.
Measuring frequency accuracy and stability is then done as if this were any other 1 PPS timing source, such as an XO, TCXO, OCXO, WWVB, Loran-C, GPS, Rubidium, or Cesium clock frequency source.
Before we start let me guess the accuracy of a PC sound card is better than a PC time-of-day clock but not as good as any laboratory frequency source. Let me also guess, since it is quartz-based, that some frequency drift will be visible.
Using a HP 53132A TI counter and a convenient GPS 1 PPS reference I recorded 1 PPS phase measurements for about 8 hours over night.
The data contained some jitter and phase jumps. This is probably due to my running it on my main PC rather than a quiet one. These have been removed in the plots below.
View of raw data from the TI counter:
C:\tvb\1hz>head -11 < log21345.txt 0.1389973689 s 0.1389532386 s 0.1389088184 s 0.1388645514 s 0.1388206957 s 0.1387757163 s 0.1387321822 s 0.1386875740 s 0.1386436972 s 0.1385992097 s 0.1385551825 s |
In just a few samples we can already see there is frequency error. If the sound card were perfectly accurate we would expect the same TI reading (phase error) between the reference 1 PPS and the sound card 1 PPS. Instead we can see that every second the sound card gets behind in the 5th decimal place. In fact with just 11 seconds of data we see the phase error is (0.1389973689 - 0.1385551825) = 0.0004421864 seconds, which is 442 microseconds over 10 seconds, or 44 ppm.
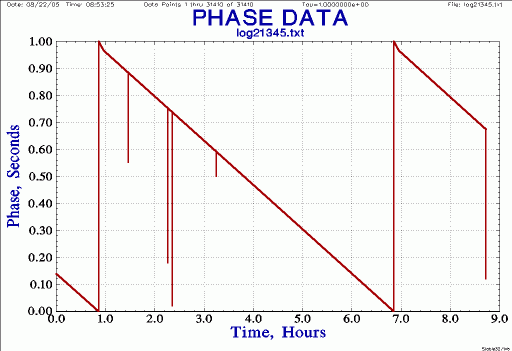
Below is a raw phase plot using Stable32. The main things to note is the gradual slope downward, the typical phase plot wrapping at one second, and a few glitches.
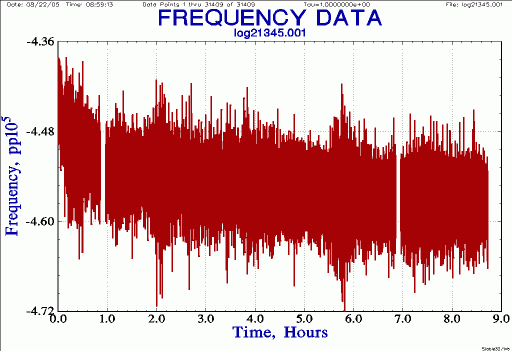
Cleaning up the data, below is a frequency plot. Note the frequency error is around -4.4e-5, which is 44 ppm (agreeing with the quick calculation from the raw phase data). Note also some irregular frequency noise, as well as a slight trend downward in frequency error.
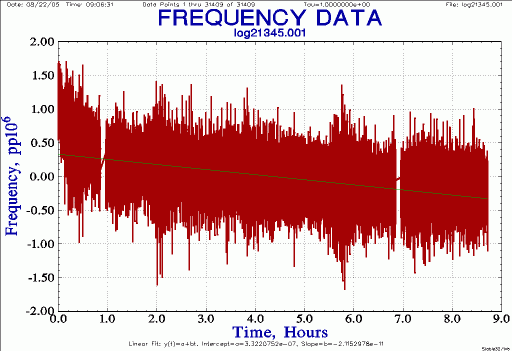
Normalizing the above gives the plot below. The peak-to-peak frequency error is on the order of ±1 ppm and the downward slope is -2.11e-11/s (* 86400 = 1.82e-6/day).
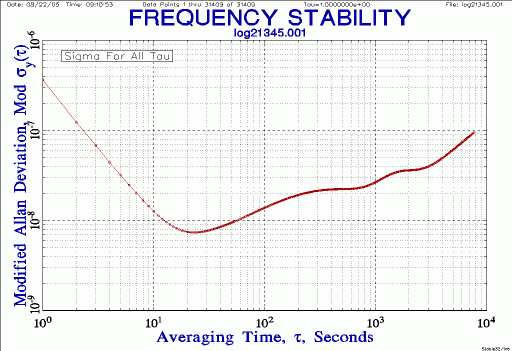
Finally, for this 8-hour run, below is the Allan deviation of the sound card: