 |
 |
05-Dec-2005
When the distribution amplifier insertion delay is many nanoseconds the raw phase difference number displayed by the 5110A is close enough to the true value and no systematic corrections are necessary.
However, when the phase difference is a few nanoseconds or less one has to consider the potential phase mismatch of the two cables, the SMA, BNC, or TNC adapters, and TSC 5110A input circuitry itself. The cables are matched but not to the picosecond. When both inputs are common the 5110A reads near zero phase but not exactly zero. These errors add up and need to be accounted for.
In reality it's hard to find patch cables matched to the picosecond and the 5110A does not appear to have either a factory or a user calibration to zero any input phase bias. This makes sense since for most time interval and all frequency stability analysis a non-zero bias is irrelevant.
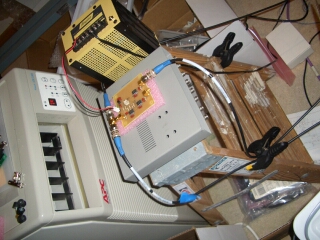
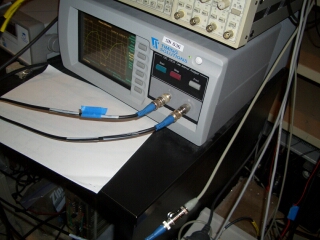
The TADD-1/proto phase measurements were made using a pair of high-quality BNC coax cables between the distribution amplifier under test and the TSC 5110A Time Interval Analyzer as seen below:
The BNC cables are 10 feet long and have a measured propagation delay of about 13.41 ns. But since the phase measurements are differential the actual length of the cable pair doesn't matter; only the difference in length, if any.
With a single measurement it is not possible to determine how much of, say, a 886 ps phase measurement is the result of TADD-1/proto insertion delay, differential cable delay, or analyzer input bias. However, by making 3 or 4 different measurements (swapping cable connectors on each end in turn) one can isolate the individual offsets and calculate the absolute phase of each component.
Four different measurements were made:
The following are phase difference snapshots for each of the four measurements. In this case only the reported center phase value is of interest; e.g., -2.52x10-10 = -252 ps.
The four measurements can be organized as a matrix:
Ch A Ch B J0 -252 ps +886 ps J2 +962 ps -328 ps
Now, let's do the arithmetic.
1) When the TSC 5110A inputs are swapped the mean phase changes from -252 ps to +886 ps. With no TSC input bias one would expect values of exactly +N and -N. Now +886 ps and -252 ps differ by 1138 ps; half of that is 569 ps. Next, 886 - 569 = 317; 569 - 252 = 317. Thus, the TSC 5110A shows a phase bias of 317 ps and all my TSC center phase readings are 317 ps too high. Making this correction turns -252 ps into -569 ps and turns +886 ps into +569 ps; the +/- N form we expected.
2) When the TADD-1/proto J0 (input) and J2 (2nd output) connectors are swapped the mean phase changes from -252 ps to +962 ps. With no system biases one would expect readings of exactly +N and -N. Now +962 ps and -252 ps differ by 1214 ps; half that is 607 ps. Thus the TADD-1/proto insertion delay is 607 ps. Note by making both a J0/J2 and J2/J0 measurement this calculation is independent of actual cable and 5110A biases, even though we now know what the 5110A bias is.
3) When both sets of TSC and TADD-1 connectors are swapped the cables themselves are effectively swapped. In this case the mean phase changes from -252 ps to -328 ps; a difference of 76 ps; half that is 38 ps, so the BNC cable phase mismatch is 38 ps. At 13.41 ns / 10 ft, or 1.34 ns / ft, this comes to 1/3 inch. Seems plausible.
So with a matrix of four measurements the absolute phase delay of the TADD-1/proto, the matched pair of BNC cables, and the TSC analyzer input channels has been measured to 1 ps accuracy.
With this test setup a +317 ps TSC bias and a +38 ps cable skew means precise measurements are off by +355 ps. Note this 1/3 ns adjustment isn't too important for measurements in the tens of ns. But it is for nanosecond and sub-nanosecond measurements.
To test the recipe, take the example of a raw center phase reading of 962 ps: 962 ps - 355 ps = 607 ps; perfect. So we now know how to adjust raw phase readings into absolute phase offsets with 1 ps accuracy. And we now know that the TADD-1/proto has an insertion delay of 0.6 ns.
To reduce the chance of cycle wrap the above measurements happened to be made with a 5 MHz reference (power levels at the TSC inputs were 2.1 and 3.0 Vpp). Using a 10 MHz reference instead (TSC input power levels 1.1 and 1.7 Vpp) gives the following matrix.
Ch A Ch B J0 -1074 ps +1529 ps J2 +1588 ps -1132 ps
This works out to a TSC bias of +227 ps, an insertion delay of 1330 ps, and a cable skew of 29 ps.
Not sure why the two results differ by as much as they do. So much for picosecond accuracy. Ideally one would generate graphs of insertion delay, cable skew, and TSC bias as functions of frequency and of input power. And output load. Or DC supply voltage. Or ambient temperature. Or ...