
17-Aug-2009
There have been reports of temperature anomalies in some Trimble Thunderbolt GPSDO receivers. This article examines the issue in detail and tries to determine the extent, if any, that this anomaly has on the actual performance of the receiver.
The Thunderbolt generates a GPS-locked 10 MHz and 1 PPS output. Frequency accuracy and stability is on the order of 1×10-11 short-term and below 1×10-13 at one day. Some units have short-term stability as low as 1×10-12 at one second. The 1PPS output is ± 20 ns of UTC.
The Thunderbolt has a Dallas/Maxim DS1620 digital thermometer on the PCB inside the aluminum enclosure. As with most GPSDO, extremely detailed information about receiver configuration, satellite tracking, and oscillator disciplining are available with RS232 commands. Trimble uses a binary protocol called TSIP. The Trimble-supplied Tboltmon.exe tool allows full configuration and display of all these parameters. This tool also optionally creates log files containing some of this data. Internal temperature is one of dozens of parameters.
Below is a sample screen shot from TBoltmon:
A sophisticated GPSDO might want to know its internal temperature so that, over time, and in the right conditions, it can better adjust the OCXO according to changes in ambient temperature. If this is the case, then a correctly operating thermometer is important.
The issue was first raised by Mark Sims in a posting to our time-nuts group. The effect is noticeable when one plots internal temperature over time, which is what his tool does.
Below is a photo of a typical Trimble Thunderbolt.
Below is a photo of the Thunderbolt PCB with the DS1620 circled in red.

Sample raw data:
| #P49 | #P73 |
|---|---|
21.824074 21.826296 21.831259 21.837948 21.846189 21.856571 21.867395 21.879360 21.892349 | 20.750000 20.750000 20.750000 20.750000 20.750000 20.850000 20.940001 21.021000 21.093901 |
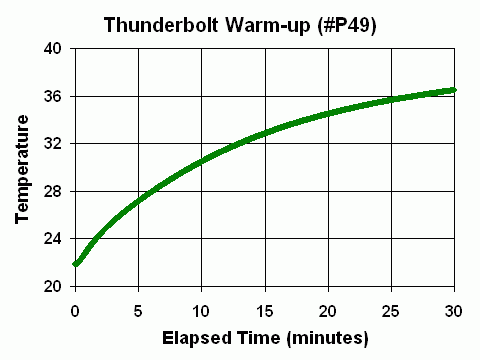
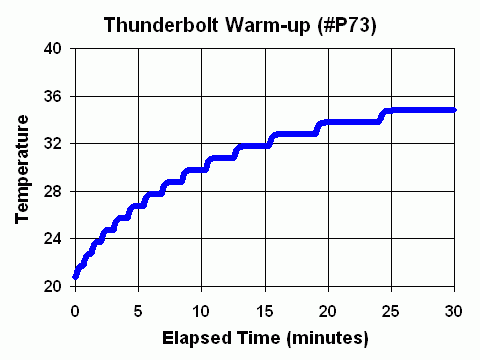
I have tested a number of Thunderbolt receivers. Two representative Thunderbolts were chosen for detailed analysis; one labeled "P49" and the other "P73". In each case the unit was at room temperature and then powered up. TSIP data was collected each second from that point on. Packet 0x8F-AC contains the temperature as measured by the internal thermometer.
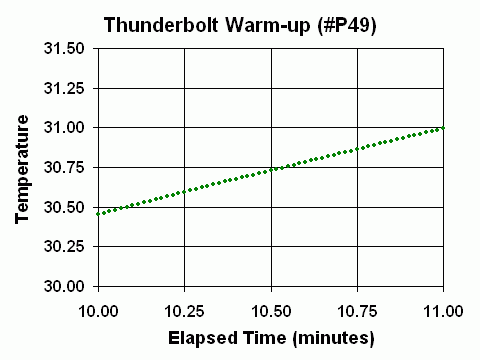
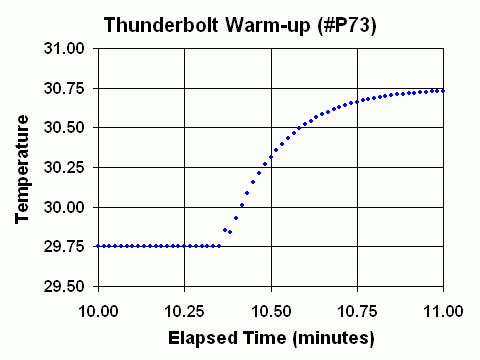
Below are two half-hour plots of data from the internal temperature sensor (the scale in each plot is 20 C high by 30 minutes wide). Both units show near identical logarithmic warm-up profiles of about +14 C above ambient. What is clearly different, however, is that #P49 reports temperature smoothly while #P73 reports temperature in steps.
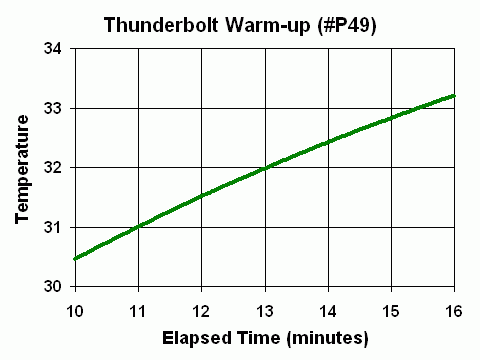
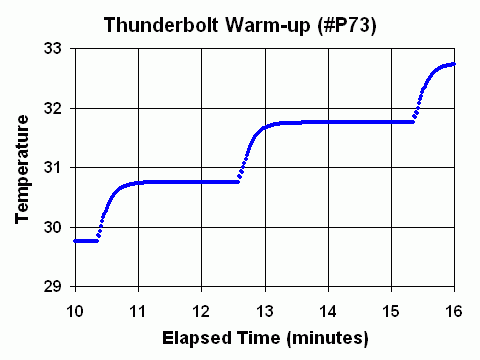
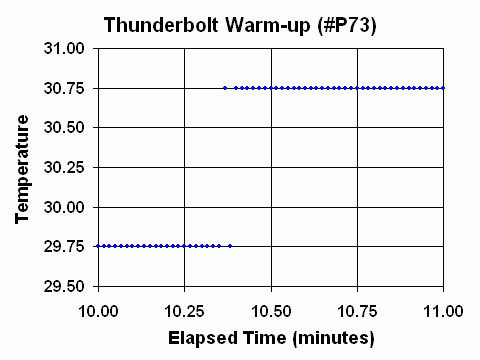
Expanding both plots confirms a very smooth ramp on #P49 and suggests the steps on #P73 are exactly 1 C in magnitude (the scale in each plot is 4 C high by 6 minutes wide).
Finally, a 1-minute plot shows individual measurements each second (the scale in each plot is 1.5 C high by 1 minute wide). The #P49 plot is nearly a perfect line at this scale while the #P73 plot shows one step in detail. It clearly isn't an instantaneous 1 C step; instead it occurs over the span of more than half a minute: some kind of time-constant is involved.
In summary, we confirm that two different variants of the Thunderbolt exist and we see vividly an example of a high-resolution and a low-resolution unit.
But the story must be more complicated than simply milli-celsius (high-resolution) vs. 1 celsius (low-resolution):
So we gather more clues.
The above time-constants can both be explained as a side-effect of averaging. It would appear based on the shape of the curves that the Thunderbolt performs a 10-sample running average on all raw temperature readings prior to sending readings to the user in a TSIP packet. The step from 28.75 to 29.75 does not occur in one sample. Instead it takes half a minute or more. But it is instructive to look at the raw data and see numerically how the temperature climbs above its 28.75 plateau on its way to 29.75. The first jump is 0.1 degree; the next jump is 0.09; and then 0.081. This strongly hints of a running average at work; a running average with a window size of 10.
28.7499
28.7499
28.7500
28.7500
28.8500  (jumps by 0.1)
28.9400  (jumps by 0.09)
29.0210  (jumps by 0.081)
29.0939  (jumps by 0.0729)
29.1595
29.2185
29.2717
...
29.7499
29.7500  (completed jump of 1.0)
The astute reader will immediately recognize the 0.9N/10 pattern in the temperature increments. It is, in fact, a 10-sample running average. Assume all the previous samples were 28.75 and then the temperature sensor measures 29.75 instead. If the TBolt returned raw data the TSIP packet would report a series of 28.75 readings and then a series of 29.75 readings, etc. But if a running average were employed by the firmware the first 29.75 reading would result in a user reading of (28.75 * 9 + 29.75) / 10, which is 28.850. The next second if the sensor again read 29.75, the value returned to the user would be (28.850 * 9 + 29.75) /10 = 28.940. The third second, (28.940 * 9 + 29.75) / 10 = 29.021. These are in fact exactly the measurements we see in the TSIP packet. So it seems pretty safe to conclude that the TBolt is averaging all the raw temperature readings for us, using a running average of 10. And this is what causes the steps to appear smooth instead of sudden. And this is what causes the apparent higher-resolution readings for the low-resolution units.
There are several ways to do averaging; so-called boxcar averaging and running or sliding or progressive averaging. The former requires one to save a group of samples in order to and compute an average. The latter can be done on-the-fly and so this is usually used.
In summary, the temperatures reported each second in the TSIP packet and displayed by any GUI program are actually a 10-sample running average of raw measurements by the 1620. This averaging occurs regardless if the sensor is high-resolution or low-resolution. It explains the rounded edges of the temperature steps. Although the raw temperature measurements are not available to the user, it is simple to reverse the running average calculation and re-create the original temperature readings.
The Thunderbolt does not give the user the actual temperature readings from the Dallas 1620 thermometer sensor. The temperature reading provided in the 0x8F-AC packet is the one which has been averaged. Now averaging temperatures is normal and sometimes even desirable. But assuming that averaged temperatures are raw temperatures instead can lead to incorrect conclusions or other types of processing errors.
It turns out that it is entirely possible to reverse the running average calculation and reconstruct the raw temperature measurements from the stream of running average temperatures.
Note the formula to compute a running average of ten samples:
    new_avg_temp = ((9 * old_avg_temp) + temp_reading) / 10
re-arranging,
    (10 * new_avg_temp) = (9 * old_avg_temp) + temp_reading
so:
    temp_reading = (10 * new_avg_temp) - (9 * old_avg_temp)
Since we log all the temperatures, we have a complete record of all the average temperatures. The equation can be re-written as:
And since we know all the avg_temp readings, we can also calculate what all the temp_reading's were.
For the 1C case it could be written as:
if
    temp_reading = old_avg_temp + 1
then
    new_avg_temp = ((9 * old_avg_temp) + (old_avg_temp + 1)) / 10
so
    new_avg_temp = old_avg_temp + 1/10
The wonderful fact is that even though all we have is a record of
running average temperatures, we can unwind the calculation
and re-create the raw temperature readings from the sensor.
Sample TSIP temperature data:
Recreated original sensor temperature data:
To show the difference this makes, below is a plot made from the TSIP averaged data and the same plot made from the recreated actual sensor data.
Again, for most people the reported temperature is of no consequence. For some it might be useful. For those applications make sure you know that it is averaged and if needed, re-create the original raw sensor temperature using the method described above.
The temperatures reported each second in the TSIP packet and displayed by any GUI program are actually a 10-sample running average of raw measurements by the 1620.
In summary, although the raw temperature measurements are not available to the user, the running average calculation can be reversed and the original temperature readings re-created, if needed.
There are not many cases where one would want to bother doing this. Averaging temperature readings is perfectly valid and very common. But I have done it here to show that the steps are steps. And also because seeing the raw data is necessary to answer the question about the resolution of the sensor.
One reason the issue of temperature sensor is of concern is that it is possible that temperature changes are feed into the algorithm that steers the OCXO. In this case the quality of the steering is partially dependent on the quality of the temperature sensor. In this case 1 K steps instead of 7 mK steps could be problematic. Is it? We'll look into that too.
// to be continued //